- Table of Contents
-
- 20-Network Management and Monitoring Configuration Guide
- 00-Preface
- 01-Ping and tracert configuration
- 02-System debugging configuration
- 03-NQA configuration
- 04-iNQA configuration
- 05-iFIT configuration
- 06-NTP configuration
- 07-SNMP configuration
- 08-RMON configuration
- 09-Sampler configuration
- 10-Mirroring configuration
- 11-NetStream configuration
- 12-IPv6 NetStream configuration
- 13-sFlow configuration
- 14-Cloud connection configuration
- 15-Packet capture configuration
- 16-IP traffic statistics collection configuration
- Related Documents
-
| Title | Size | Download |
|---|---|---|
| 05-iFIT configuration | 507.85 KB |
Application-level iFIT measurement
iFIT measurement based on SBFD
iFIT measurement based on BFD in echo packet mode
Configuring application-level iFIT measurement
Application-level iFIT measurement tasks at a glance
Configuring a measurement mode
Configuring a measurement period
Configuring a transmit node and the egress node
Verifying and maintaining application-level iFIT meaurement
Displaying and clearing iFIT measurement information
iFIT configuration examples for application-level iFIT measurement
Example: Configuring iFIT in an EVPN L3VPN network
Example: Configuring iFIT in an IPv4 L3VPN over SRv6 network
Example: Configuring iFIT in an IPv6 EVPN L3VPN over SRv6 network
Configuring tunnel-level iFIT measurement
Verifying and maintaining iFIT tunnel-level iFIT measurement
Configuring iFIT
About iFIT
In-situ Flow Information Telemetry (iFIT) determines network performance by measuring the packet loss and packet delay of service packets transmitted on an SRv6 network. iFIT is easy to deploy and provides an accurate assessment of network performance.
iFIT can be used for the following purposes:
· Application-level iFIT measurement—Measures the metrics such as the packet loss rate and delay when service traffic passes through the transmission network. The measurement result can be used to assess the network transmission quality for the service traffic.
· Tunnel-level iFIT measurement—Measures the metrics such as the packet loss rate and delay when packets pass through SRv6 tunnels. The measurement results can be used for intelligent route selection of the SRv6 TE policy module.
Application-level iFIT measurement
Application scenarios
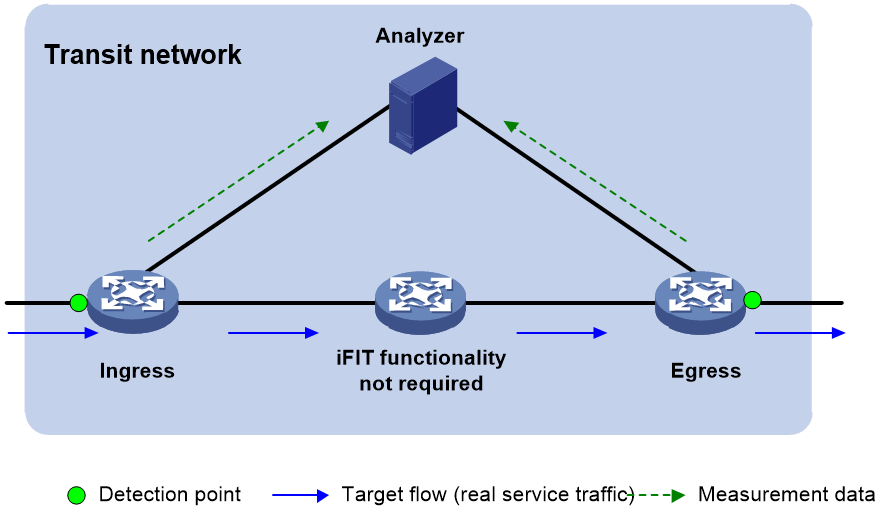
End-to-end measurement
To measure the packet loss and packet delay on the entire network, use end-to-end measurement. As shown in Figure 1, iFIT measures whether packet loss or packet delay occurs between the ingress node (where the target flow enters the IP network) and the egress node (where the flow leaves the network).
Figure 1 End-to-end measurement
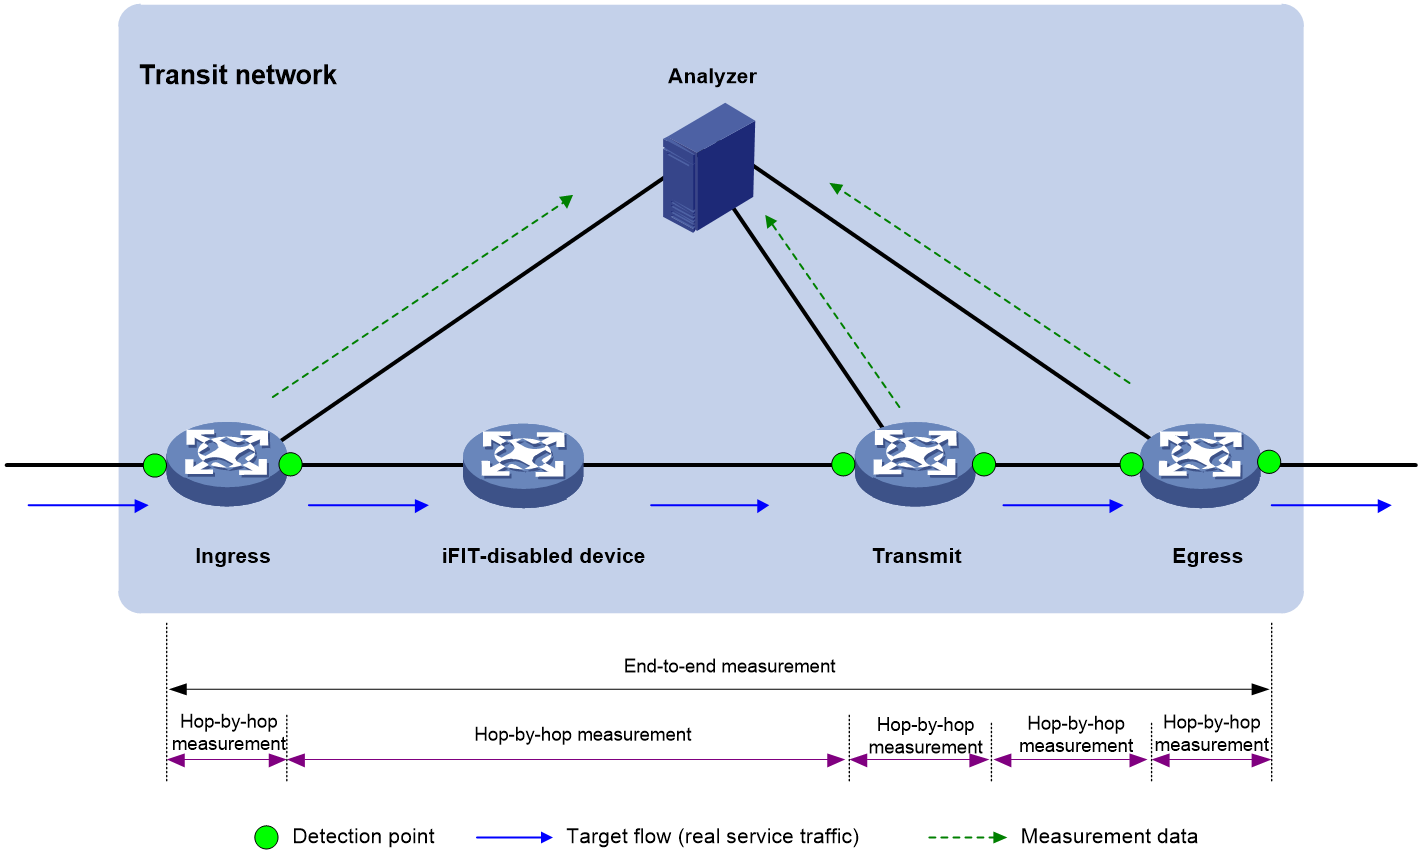
Hop-by-hop measurement
To accurately locate the packet loss and packet delay of each network node, use hop-by-hop measurement. To locate the faulty node, you can divide an end-to-end network into smaller measurement spans. As shown in Figure 2, iFIT measures whether the packet loss and packet delay occurs between the ingress node and egress node, ingress node and transmit node, transmit node and egress node.
Figure 2 Hop-by-hop measurement
iFIT architecture
Figure 1 and Figure 2 show the important iFIT concepts including target flow, transit network, and measurement system.
Target flow
iFIT provides statistics on a per-flow basis. The target flows can be divided into the following types:
· Static flow—A static flow is specified on the ingress node and encapsulated with iFIT header. You can specify a flow on the ingress node by using any combination of the following items: source IP address/segment, source port number, destination IP address/segment, destination port number, protocol type, DSCP value, and VPN instance.
An iFIT header contains fields to carry device ID, flow ID, measurement period, measurement mode, status of packet delay measurement, and status of packet loss measurement.
¡ A device ID uniquely identifies a device in an iFIT measurement network.
¡ A flow ID is automatically generated on the ingress node and passed to the transmit nodes and egress node. A flow ID and a device ID uniquely identify a flow together.
¡ Within a measurement period, the device starts iFIT measurement, collects and reports the measurement data.
¡ The available measurement mode includes end-to-end measurement and hop-by-hop measurement.
· Dynamic flow—A dynamic flow is learnt by the transmit nodes and egress node after they parse the received packets.
The device uses the device ID and flow ID in the iFIT header to identify the flow. If the device does not receive the packets using the same device ID and the same flow ID for a period of time, the device will delete the dynamic flow entry.
Detection point
A detection point is an interface where iFIT measurement is performed. You can specify detection points as required.
Transit network
The transit network only bears target flows. The target flows are not generated or terminated on the transit network. The transit network can only be a Layer 3 network. Each node on the transit network must be reachable.
Measurement system
The measurement system includes the following device role:
· The ingress node refers to the node that the flow enters the transit network. It filters the target flow, adds iFIT headers to the packets of the flow, collects packet statistics and reports packet statistics to the analyzer.
· A transmit node identifies the target flow by the iFIT header and reports the measurement statistics to the analyzer according to the measurement mode in the iFIT header.
· The egress node identifies the target flow by the iFIT header, reports the measurement statistics to the analyzer, and removes the iFIT header from the packet.
· The analyzer collects the statistics reported by the ingress node, transmit nodes, and egress node for data summarization and calculation.
Operating mechanism
Time synchronization mechanism
Before starting the iFIT measurement, make sure all devices are time synchronized. Therefore, all iFIT-enabled devices can use the same measurement period to report the packet statistics to the analyzer. As a best practice, the analyzer and all iFIT-enabled devices are time synchronized to facilitate management and maintenance.
You can use NTP to synchronize time between devices. Time synchronized through NTP is accurate to milliseconds. For more information about NTP, see "Configuring NTP".
Packet loss measurement mechanism
The number of incoming packets and that of outgoing packets in a network should be equal within a measurement period. If they are not equal, packet loss occurs in the transit network.
Measurement data reporting mechanism
iFIT-enabled devices push the measurement data to the analyzer by using the gRPC protocol.
Currently, only gRPC dial-out mode is supported. In this mode, iFIT-enabled devices act as gRPC clients and the analyzer acts as a gRPC server (also called a gRPC collector in the gRPC protocol), The iFIT-enabled devices will initiates gRPC connections to the analyzer and push iFIT data to the analyzer.
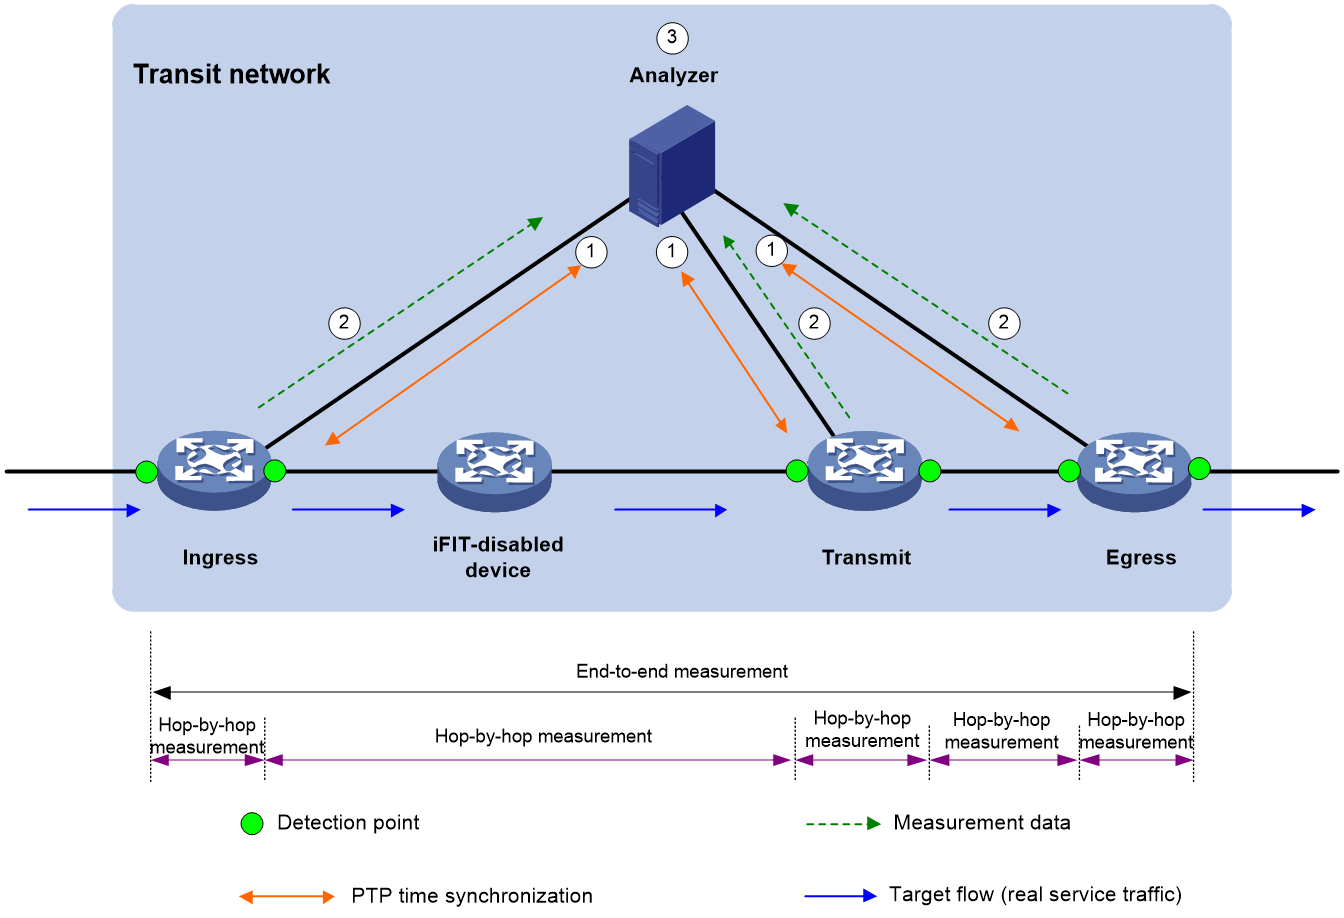
Working mechanism
The following illustrates the working mechanism of hop-by-hop measurement. No transmit nodes exist in end-to-end measurement but end-to-end measurement works similarly as hop-by-hop measurement.
As shown in Figure 3, the flow passes through four devices. Three devices are enabled with iFIT. The iFIT measurement works as follows:
1. The analyzer synchronizes the time with all iFIT-enabled devices through the NTP protocol.
2. The iFIT-enabled devices takes the following actions:
a. The ingress node parses the packets to identify the target flow. It encapsulates iFIT headers to the packets, counts the number of packets, and reports the packet quantity and timestamp to the analyzer through gRPC periodically.
The ingress node is the interface bound to the target flow.
b. A transmit node counts the number of packets containing iFIT headers and reports the packet quantity and timestamp to the analyzer through gRPC periodically.
When the target flow passes through an iFIT-enabled device, the interfaces where the target flow enters the iFIT-enabled device and leaves the iFIT-enabled device are transmit nodes.
c. The egress node parses the packets to identify the target flow. It counts the number of packets containing iFIT headers, reports the packet quantity and timestamp to the analyzer through gRPC periodically, removes iFIT headers from the packets and forwards the packets.
When the target flow leaves the transit network, the interface where the target flow leaves the iFIT-enabled device is the egress point.
3. The analyzer calculates the packet delay for the target flow of the same period and same instance.
Tunnel-level iFIT measurement
iFIT can collaborate with an SRv6 TE policy to measure the end-to-end quality of the SRv6 tunnel of the SRv6 TE policy. The measurement result can be used for intelligent route selection of the SRv6 TE policy module
Application scenarios
Specifying H3C devices the ingress node and egress node of an SRv6 TE policy
When both the ingress and egress nodes of an SRv6 TE policy are H3C devices, configure end-to-end iFIT measurement as a best practice for the SRv6 TE policy. In this case, the egress node of an SRv6 TE policy returns the iFIT measurement result to the ingress node for calculating the network quality of the SRv6 TE policy. Even if the transmit nodes where the target flow passes through have iFIT enabled and detect iFIT messages, these transmit nodes will not return the iFIT measurement results to the ingress node of the SRv6 TE policy. This reduces the complexity of device processing.
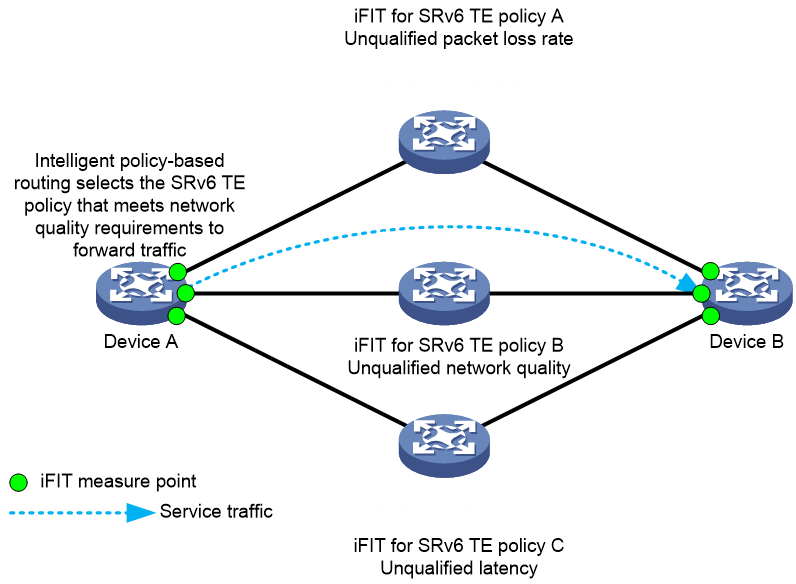
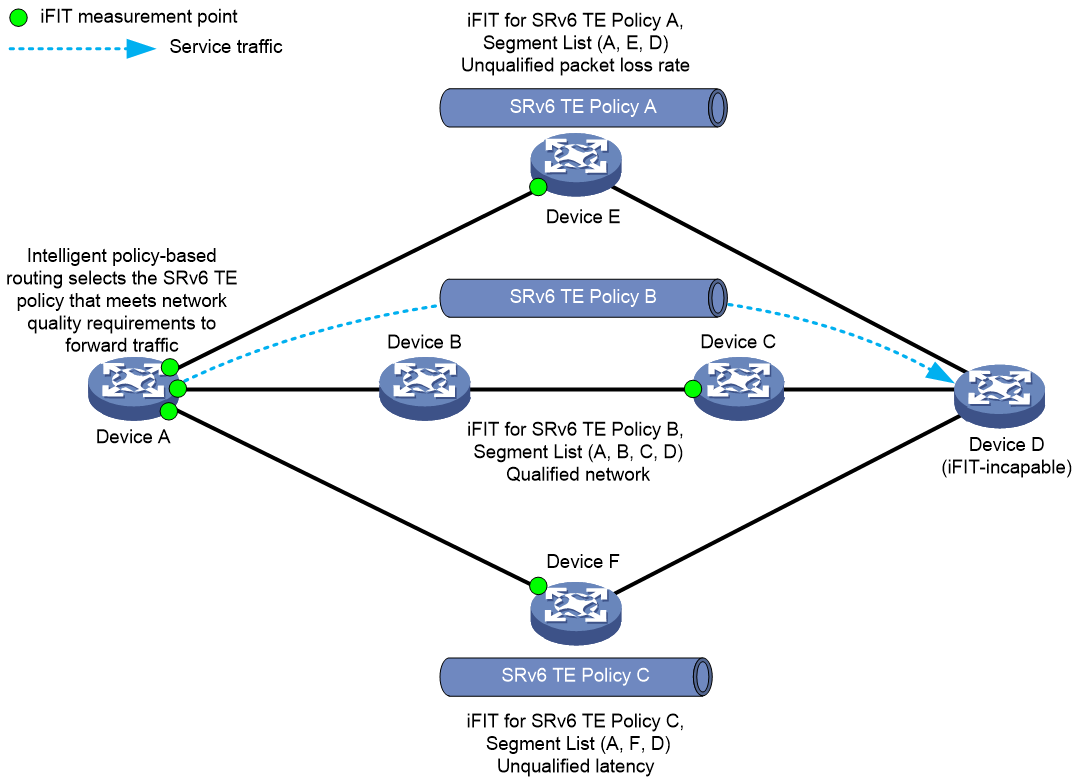
Figure 4 shows a typical application scenario for end-to-end tunnel-level iFIT measurement:
1. Enable iFIT on the ingress node and egress node of an SRv6 TE policy.
2. The ingress node and egress node will measure the transmitted packet count, delay, and jitter of the SRv6 tunnel periodically based on the iFIT operating mechanism.
3. The egress node returns the iFIT measurement result to the ingress node.
4. The ingress node collects and calculates the packet loss rate, delay, and jitter for each SRv6 TE policy path and provides the measurement results to the SRv6 TE policy module on the same node.
5. The SRv6 TE policy module on the ingress node will select the optimal forwarding path for the service traffic intelligently based on the iFIT measurement results.
Figure 4 iFIT support for end-to-end SRv6 TE policy intelligent route selection
For more information about the SRv6 TE policies and BFD for the SRv6 TE policies, see SRv6 TE policies configuration in Segment Routing Configuration Guide.
Specifying a non-H3C device as the egress node of an SRv6 TE policy
When both the egress node of an SRv6 TE policy is a non-H3C device, you must configure hop-by-hop iFIT measurement for the SRv6 TE policy, enable iFIT on the penultimate hop, and specify the penultimate hop for iFIT measurement as the collector. If the penultimate hop does not support iFIT either, enable iFIT on the nearest H3C device along the forwarding path to the egress node that supports iFIT. The collector uses the non-H3C device as a data receiver to gather statistics, establishes a UDP session with the ingress node, and returns the statistics to the ingress node, completing the functionality of the egress node. Hop-by-hop measurement is typically applies in scenarios where the ingress node of an SRv6 TE policy is a non-H3C device.
Figure 5 shows a typical application scenario for hop-by-hop tunnel-level iFIT measurement:
1. Enable iFIT on the ingress node of the SRv6 TE policy and the penultimate hop.
2. The ingress node and the penultimate hop periodically measure the number of packets, delay, and jitter on the SRv6 tunnel according to the iFIT operating mechanism.
3. The penultimate hop returns the iFIT measurement to the ingress node.
4. The ingress node collects and calculates the packet loss rate, delay, and jitter for each SRv6 TE policy path and provides the measurement results to the SRv6 TE policy module on the same node.
5. The SRv6 TE policy module on the ingress node will select the optimal forwarding path for the service traffic intelligently based on the iFIT measurement results.
Figure 5 iFIT support for hop-by-hop SRv6 TE policy intelligent route selection
iFIT architecture
In application-level iFIT measurement, iFIT reports measurement results to a collector via Telemetry, which then performs aggregation and calculations. For intelligent router selection of the SRv6 TE policy module, iFIT reports measurement results from both the ingress and egress nodes of the SRv6 TE policies to the ingress node, where the results are aggregated and calculated. The iFIT tunnel-level iFIT measurement architecture mainly includes three components: target flow, Collector, and Analyzer.
Target flow
iFIT reuses BFD sessions of the SRv6 TE policy and use them as the target flow to encapsulate iFIT headers to the matched BFD packets for iFIT measurement. This provides the following benefits:
· Use BFD to detect SRv6 TE policy connectivity, providing millisecond-level fault detection speed and enabling fast fault switchover.
· iFIT reuses BFD packets as the target flow for link iFIT measurement, simplifying network configuration and software complexity.
An SRv6 TE policy supports both seamless BFD (SBFD) and BFD in echo packet mode for iFIT measurement in different application scenarios, as shown in Table 1.
Table 1 Application scenarios of iFIT based on BFD types
|
iFIT network |
Application scenarios |
Measurement requirements |
|
iFIT measurement based on SBFD |
Packet loss measurement |
Requirements on this type of measurement are the same as the common iFIT measurement as follows: · Clock synchronization is performed between the ingress and egress nodes. · The one-way network delay between the ingress and egress nodes is equal to or smaller than 1/3 measurement period. |
|
Two-way delay measurement |
Synchronize the clock between the ingress and egress nodes and require high precision time synchronization. As a best practice, use high-precision PTP time synchronization to ensure accurate delay measurement results. |
|
|
iFIT measurement based on BFD in echo packet mode |
Packet loss measurement |
Requirements on this type of measurement are the same as the common iFIT measurement. |
|
Two-way delay measurement |
No requirements on clock synchronization. |
Collector
Collector is deployed on the egress node of the SRv6 TE policy.
The egress node that operates in Collector mode sends the local iFIT measurement results for SRv6 paths to the ingress node (Analyzer) of the SRv6 TE policy via UDP packets.
Analyzer
Analyzer is deployed on the ingress node of the SRv6 TE policy.
A node performs the following tasks when operating in Analyzer mode:
· Forwards the local iFIT measurement results to Analyzer on the same node.
· Analyzer aggregates and calculates the iFIT measurement results received from both the ingress and egress nodes, deriving metrics such as packet loss, delay, and jitter for the SRv6 tunnels.
iFIT measurement based on SBFD
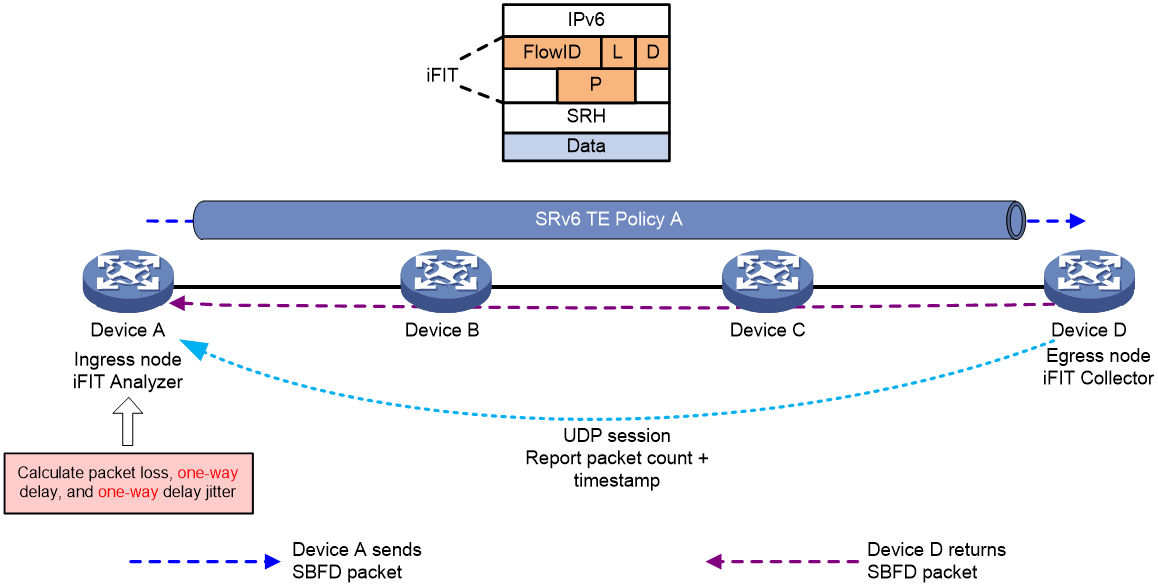
As shown in Figure 6, iFIT based on SBFD operates as follows:
1. Synchronize time between the ingress and egress nodes.
2. Use iFIT for the SRv6 TE policy on the ingress node and issue measurement parameters to iFIT, such as the segment list ID of the SRv6 tunnel, iFIT measurement period, whether to measure packet loss, whether to measure one-way or two-way delay, packet loss rate criteria, delay criteria, and jitter criteria.
3. The ingress node automatically creates an iFIT instance and assigns a FlowID to it.
4. The BFD service module on the ingress node generates SBFD packets for the SRv6 tunnel, adds SRv6 encapsulation to these packets with segment list ID of the SRv6 tunnel encapsulated. Then, the BFD service module notifies the iFIT service module to initiate iFIT measurement.
5. The iFIT instance on the ingress node matches the segment list ID in SBFD packets by the segment list ID in the SRv6 TE policy:
¡ For the matched SBFD packets, iFIT performs packet loss and delay measurements and sends the results to the local Analyzer module. iFIT considers SBFD packets as service packets, and packet loss and delay measurements based on SBFD are the same as the application-level iFIT measurement of iFIT.
¡ For the unmatched SBFD packets, iFIT does not perform a measurement.
6. The egress node parses the iFIT headers in the packets and performs iFIT packet loss and delay measurements.
7. Collector (egress node) establishes a UDP session with the ingress node based on the source address of the received packets and sends the counted packet statistics and packet timestamps to the ingress node over the UDP session, according to the iFIT measurement period defined in the SRv6 TE policy.
8. Analyzer (ingress node) calculates the packet loss rate by comparing the number of SBFD packets received on the ingress and egress nodes and computes one-way delay and one-way jitter based on the timestamp when an SBFD packet was sent from the ingress node and timestamp when the same packet was received on the egress node. If the calculated results exceed the packet loss rate, delay, or jitter thresholds defined in the SRv6 TE policy, Analyzer reports the exceeding metrics to the local SRv6 TE policy module on the same node. iFIT will then immediately notify the SRv6 TE policy to initiate a link switch. These results will be used for intelligent route selection through the SRv6 TE policy.
Figure 6 iFIT measurement based on SBFD
iFIT measurement based on BFD in echo packet mode
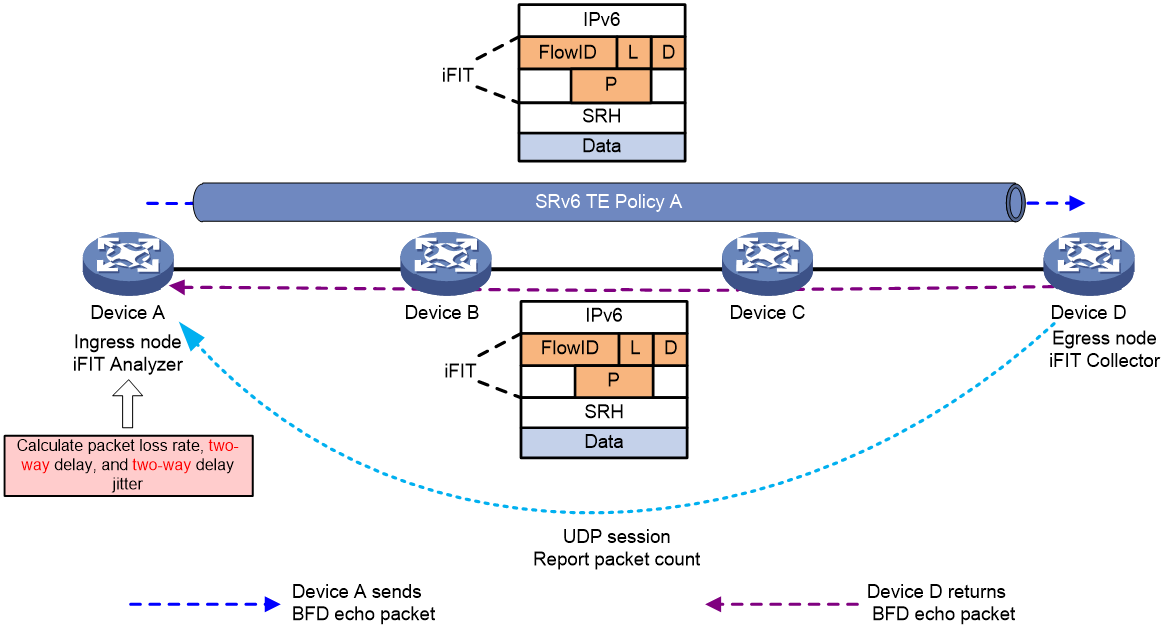
As shown in Figure 7, iFIT based on BFD in echo packet mode operates as follows:
1. Synchronize time between the ingress and egress nodes.
2. Use iFIT for the SRv6 TE policy on the ingress node and issue measurement parameters to iFIT, such as the segment list ID of the SRv6 tunnel, iFIT measurement period, whether to measure packet loss, and whether to measure one-way or two-way delay.
3. The ingress node automatically creates an iFIT instance and assigns a FlowID to it.
4. The BFD service module on the ingress node generates BFD echo packets for the SRv6 tunnel, adds SRv6 encapsulation to these packets with segment list ID of the SRv6 tunnel encapsulated. Then, the BFD service module notifies the iFIT service module to initiate iFIT measurement.
5. The iFIT instance on the ingress node matches the segment list ID in BFD echo packets by the segment list ID in the SRv6 TE policy:
¡ For the matched BFD echo packets, iFIT performs packet loss and delay measurements and sends the results to the local Analyzer module. iFIT considers BFD echo packets as service packets, and packet loss and delay measurements based on BFD in echo packet mode are the same as the application-level iFIT measurement of iFIT.
¡ For the unmatched BFD echo packets, iFIT does not perform a measurement.
6. The egress node parses the iFIT headers in the packets and performs iFIT packet loss and delay measurements.
7. Collector (egress node) establishes a UDP session with the ingress node based on the source address of the received packets and sends the counted packet statistics to the ingress node over the UDP session, according to the iFIT measurement period defined in the SRv6 TE policy.
8. The egress node forwards the received BFD echo packets back to the ingress node along the original path.
9. The ingress node performs iFIT measurement on the returned BFD echo packets and sends the measurement results to the local Analyzer service module.
10. Analyzer (ingress node) calculates the packet loss rate by comparing the number of BFD echo packets received on the ingress and egress nodes and computes two-way delay and two-way jitter based on the timestamp when a BFD echo packet was sent from the ingress node and timestamp when the same packet was received on the egress node. If the calculated results exceed the packet loss rate, delay, or jitter thresholds defined in the SRv6 TE policy, Analyzer reports the exceeding metrics to the local SRv6 TE policy module on the same node. iFIT will then immediately notify the SRv6 TE policy to initiate a link switch. These results will be used for intelligent route selection through the SRv6 TE policy.
Figure 7 iFIT measurement based on BFD in echo packet mode
Configuring application-level iFIT measurement
Application-level iFIT measurement measures the metrics such as the packet loss rate and delay when service traffic passes through the transmission network. The measurement result can be used to assess the network transmission quality for the service traffic.
Restrictions and guidelines
An iFIT instance monitors only one flow. If you configure flows multiple times for an iFIT instance, the most recent configuration takes effect.
For the flows to be monitored by different instances, the flow attributes must not be identical and cannot conflict to avoid inaccurate measurement result.
As a best practice, configure iFIT first on the transmit nodes and the egress node and then the ingress node. Thus, the measurement results of the previous measurement periods will not affected if iFIT measurement starts on the ingress node but not on the transmit nodes and the egress node.
Modifying the iFIT instance or restarting the ingress node will cause flow ID change, which might cause inaccurate measurement data or no data in several measurement periods.
SRv6 includes SRv6 TE and SRv6 BE networks. The iFIT configuration varies by network type as follows:
· In an SRv6 TE network, configure iFIT on nodes in a SID list. If a transmit node is not in a SID list, iFIT measurement cannot be performed even after you configure iFIT on the transmit node.
· In an SRv6 BE network, if you specify hop-by-hop measurement as the measurement mode, iFIT generates iFIT data only on the ingress and egress nodes during SRv6 forwarding. The transmit nodes only forward IPv6 packets and do not participate in SRv6 processing, so no iFIT data is generated on the transmit nodes.
Prerequisites
Before configuring iFIT, make sure the analyzer and iFIT-enabled devices are time synchronized through NTP. For more information about NTP, see "Configuring NTP."
To enable the iFIT-enabled devices to report the measurement results to the analyzer, configure gRPC on the analyzer and iFIT-enabled devices. For more information about gRPC, see gRPC configuration in Telemetry Configuration Guide.
Application-level iFIT measurement tasks at a glance
To configure iFIT for application-level iFIT measurement, perform the following tasks:
2. Configuring a transmit node and the
3. Verifying and maintaining application-level iFIT meaurement
Configuring the ingress node
Tasks at a glance
To configure the ingress node, perform the following tasks:
· Configuring a detection point
· Configuring a measurement mode
· Configuring a measurement period
Configuring iFIT
1. Enter system view.
system-view
2. Enable the iFIT functionality globally and enter its view, or enter the existing iFIT view.
ifit enable
By default, the iFIT functionality is disabled.
3. Specify a device ID.
device-id device-id
By default, no device ID is specified.
A device ID is required and uniquely identifies a device in an iFIT measurement network.
Creating an iFIT instance
1. Enter system view.
system-view
2. Enter iFIT view.
ifit enable
3. Create an iFIT instance and enter its view.
instance instance-name
Configuring a static flow
About this task
Static flows are key elements for iFIT measurement. Before starting an iFIT measurement, you must configure a static flow to be measured on the ingress node. You do not need to configure a static flow on the transmit nodes and egress node because the device can automatically learn the static flow through the iFIT header of the packets.
The device can perform iFIT measurement based on the following granularities in different scenarios:
· 5-tuple granularity—Measures communication quality of service flows. You can use 5-tuple elements to match service flows and perform iFIT measurement on any service traffic on a network. This granularity is available for all networks supported by iFIT.
· PeerLocator granularity—Measures end-to-end communication quality on the entire network. The device performs iFIT measurement on all service flows through tunnels.
Procedure
1. Enter system view.
system-view
2. Enter iFIT view.
ifit enable
3. Create an iFIT instance and enter its view.
instance instance-name
4. Specify a static flow to be monitored by the instance.
¡ iFIT measurement based on 5-tuple granularity:
- IPv4:
flow unidirection source-ip src-ip-address [ src-mask-length ] destination-ip dest-ip-address [ dest-mask-length ] [ protocol { { tcp | udp | sctp } [ source-port src-port-number ] [ destination-port dest-port-number ] | protocol-number } ] [ dscp dscp-value ] [ vpn-instance vpn-instance-name ]
- IPv6:
flow unidirection source-ipv6 src-ipv6-address [ src-prefix-length ] destination-ipv6 dest-ipv6-address [ dest-prefix-length ] [ protocol { { tcp | udp | sctp } [ source-port src-port-number ] [ destination-port dest-port-number ] | protocol-number } ] [ dscp dscp-value ] [ vpn-instance vpn-instance-name ]
¡ iFIT measurement based on PeerLocator granularity:
- IPv4:
flow unidirection source-ip any destination-ip any [ vpn-instance vpn-instance-name ] peer-locator ipv6-address prefix-length
undo flow
- IPv6:
flow unidirection source-ipv6 any destination-ipv6 any [ vpn-instance vpn-instance-name ] peer-locator ipv6-address prefix-length
undo flow
By default, no static flow is specified for an iFIT instance.
Configuring a detection point
About this task
Before enabling iFIT measurement on the ingress node of an instance, execute this command to bind an interface to the instance. After you bind an interface to an instance, iFIT parses the packets passing through the interface to identify the target packets and add an iFIT header to each target packets. Meanwhile, iFIT will count the number of target packets, and send the packet count and timestamp to the analyzer at intervals through gRPC.
Procedure
1. Enter system view.
system-view
2. Enter iFIT view.
ifit enable
3. Create an iFIT instance and enter its view.
instance instance-name
4. Bind an interface to the instance.
bind interface interface-type interface-number
By default, an instance is not bound to any interface.
Before enabling iFIT measurement on the ingress node of an instance, execute this command to bind an interface to the instance.
Configuring a measurement mode
1. Enter system view.
system-view
2. Enter iFIT view.
ifit enable
3. Create an iFIT instance and enter its view.
instance instance-name
4. Specify an iFIT measurement mode.
measure mode { e2e | trace }
By default, end-to-end measurement is used.
Configuring a measurement period
About this task
iFIT collects performance statistics based on the measurement period.
· The sender records the sending time of the first iFIT packet in each sending interval, and counts the number of the iFIT packets sent from an interface in each sending interval. Sending interval = iFIT measurement period.
· The receiver records the receiving time of the first iFIT packet in each receiving interval, and counts the number of the iFIT packets received by an interface in each receiving interval. To reduce the impact of network delay and disorder on statistics, the receiving interval equals to (1+1/3) measurement period.
If network delay between the ingress and egress nodes is greater than 1/3 measurement period, the accuracy of iFIT packet loss statistics might be affected. This is because iFIT considers packets received beyond the receiving interval as packet loss. For example, the measurement period is 1 second and the network delay greater than 1/3 seconds (333 milliseconds), the accuracy of iFIT packet loss statistics might be affected. In this case, set the measurement period to a greater value.
Procedure
1. Enter system view.
system-view
2. Enter iFIT view.
ifit enable
3. Create an iFIT instance and enter its view.
instance instance-name
4. Specify the measurement period for the iFIT instance.
period period
By default, the measurement period for an iFIT instance is 30 seconds.
Enabling iFIT measurement
1. Enter system view.
system-view
2. Enter iFIT view.
ifit enable
3. Create an iFIT instance and enter its view.
instance instance-name
4. Enable iFIT measurement for the iFIT instance.
measure enable
By default, iFIT measurement for an iFIT instance is disabled.
Configuring a transmit node and the egress node
Tasks at a glance
Transmit nodes are required only for hop-by-hop measurement. For end-to-end measurement, do not configure transmit nodes.
To configure a transmit node or the ingress node, perform the following tasks:
· (Optional.) Managing a dynamic flow
Configuring iFIT
1. Enter system view.
system-view
2. Enable the iFIT functionality globally and enter its view.
ifit enable
By default, the iFIT functionality is disabled.
Managing a dynamic flow
1. Enter system view.
system-view
2. Enable the iFIT functionality globally and enter its view.
ifit enable
3. Specify the aging time for dynamic flows.
dynamic-flow aging-time multi-value
By default, the aging time for dynamic flows is 10 times the measurement period and it cannot be less than 5 minutes.
4. Delete iFIT dynamic flows.
delete dynamic-flow { device-id device-id flow-id flow-id | all }
Verifying and maintaining application-level iFIT meaurement
Displaying iFIT target flows
Perform display tasks in any view.
· Display static flow information.
display ifit flow static [ flow-id flow-id ]
· Display dynamic flow information.
display ifit flow dynamic [ device-id device-id flow-id flow-id ]
· Display global information about iFIT target flows.
display ifit global-information
Displaying iFIT instances
To display iFIT instance information, execute the following command in any view:
display ifit instance [ instance-name ]
Displaying and clearing iFIT measurement information
Perform clear tasks in user view.
To display iFIT measurement statistics in the most recent 10 measurement periods, execute the following command in any view:
display ifit statistic device-id device-id flow-id flow-id [ verbose ]
To clear iFIT measurement statistics in the most recent 10 measurement periods, execute the following command in user view:
reset ifit statistic [ device-id device-id flow-id flow-id | instance instance-name]
iFIT configuration examples for application-level iFIT measurement
Example: Configuring iFIT in an EVPN L3VPN network
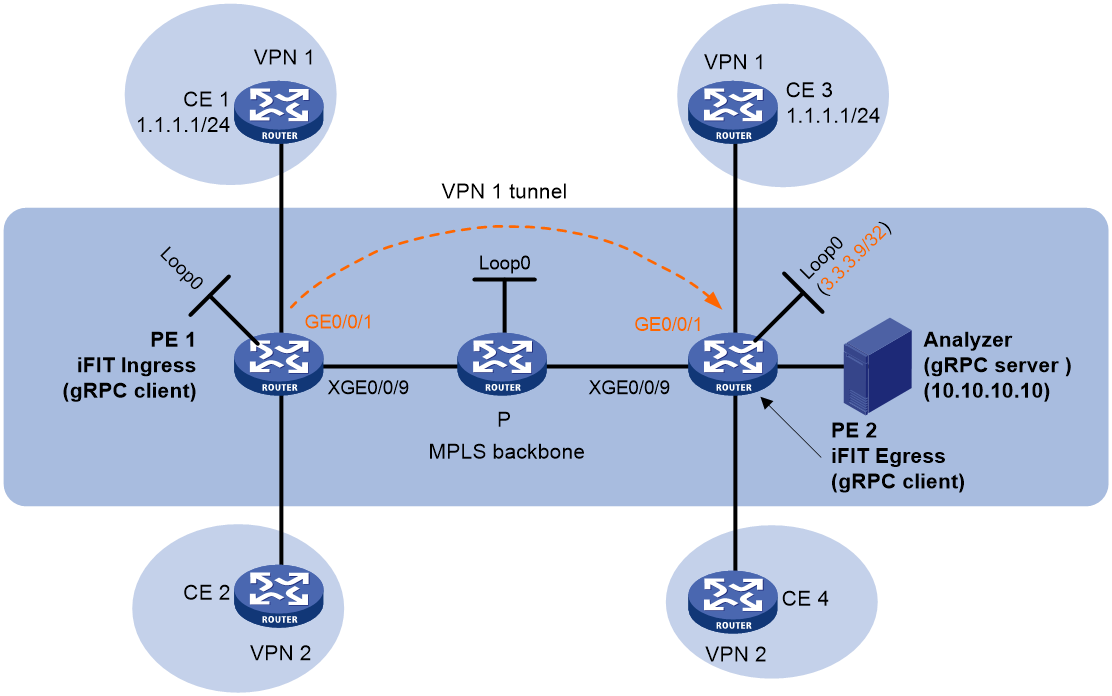
As shown in Figure 8:
· Configure IPv4 EVPN L3VPN for different sites of a VPN instance to communicate with each other.
· Configure the CE and the PE of each site to use EBGP to exchange VPN routes.
· Configure the PEs to communicate through OSPF and to exchange BGP EVPN routes through MP-IBGP.
· Configure iFIT to monitor the occurrence of packet loss and packet delay value when the flow passes through the VPN 1 tunnel.
Prerequisites
1. Configure EVPN L3VPN. (Details not shown.)
For information about configuring EVPN L3VPN, see EVPN L3VPN configuration in EVPN Configuration Guide.
2. Configure NTP on PE 1 and PE 2 for clock synchronization. (Details not shown.)
For information about configuring NTP, see "Configuring NTP."
Procedure
1. Configure gRPC:
# Enable the gRPC service.
<PE1> system-view
[PE1] grpc enable
# Create a sensor group named test, and add sensor path ifit/flowstatistics/flowstatistic.
[PE1] telemetry
[PE1-telemetry] sensor-group test
[PE1-telemetry-sensor-group-test] sensor path ifit/flowstatistics/flowstatistic depth 2
[PE1-telemetry-sensor-group-test] quit
# Create a destination group named collector1. Specify a collector that uses IPv4 address 10.10.10.10 and port number 50050.
[PE1-telemetry] destination-group collector1
[PE1-telemetry-destination-group-collector1] ipv4-address 10.10.10.10 port 50050
[PE1-telemetry-destination-group-collector1] quit
# Configure a subscription named A to bind sensor group test with destination group collector1. Set the sampling interval to 5 seconds.
[PE1-telemetry] subscription A
[PE1-telemetry-subscription-A] sensor-group test sample-interval 5
[PE1-telemetry-subscription-A] destination-group collector1
[PE1-telemetry-subscription-A] quit
[PE1-telemetry] quit
2. Configure iFIT:
# Enable the iFIT functionality.
[PE1] ifit enable
[PE1-ifit] device-id 1
# Configure instance a to monitor the unidirectional flow passing through the VPN 1 tunnel.
[PE1-ifit] instance a
[PE1-ifit-instance-a] flow unidirection source-ip 1.1.1.1 24 destination-ip 1.1.2.1 24 vpn-instance vpn1
# Bind interface Ten-GigabitEthernet0/0/6 to instance a.
[PE1-ifit-instance-a] bind interface ten-gigabitethernet 0/0/6
# Specify 10 seconds as the measurement period.
[PE1-ifit-instance-a] period 10
# Specify end-to-end measurement as the measurement mode.
[PE1-ifit-instance-a] measure mode e2e
# Enable iFIT measurement.
[PE1-ifit-instance-a] measure enable
[PE1-ifit-instance-a] quit
[PE1-ifit] quit
3. Configure PE 2:
# Configure gRPC.
Use the same procedure to configure gRPC on PE 2 as you configure gRPC on PE 1.
# Enable the iFIT functionality.
<PE2> system-view
[PE2] ifit enable
Verifying the configuration
1. View iFIT statistics on PE 1.
[PE1] display ifit statistic device-id 1 flow-id 3
Period ID Direction PktCount Timestamp(sec, nsec) Interface
163059918 Ingress 4124 1630599180, 1889782 XGE0/0/6
163059919 Ingress 4124 1630599190, 1901494 XGE0/0/6
163059920 Ingress 4124 1630599200, 1912118 XGE0/0/6
2. View iFIT statistics on PE 2.
[PE2] display ifit statistic device-id 1 flow-id 3
Period ID Direction PktCount Timestamp(sec, nsec) Interface
163059918 Egress 4124 1630599180, 1948185 XGE0/0/6
163059919 Egress 4124 1630599190, 1959405 XGE0/0/6
163059920 Egress 4120 1630599200, 1968503 XGE0/0/6
3. Packet loss occurs in period 163059920 by viewing iFIT statistics on the analyzer.
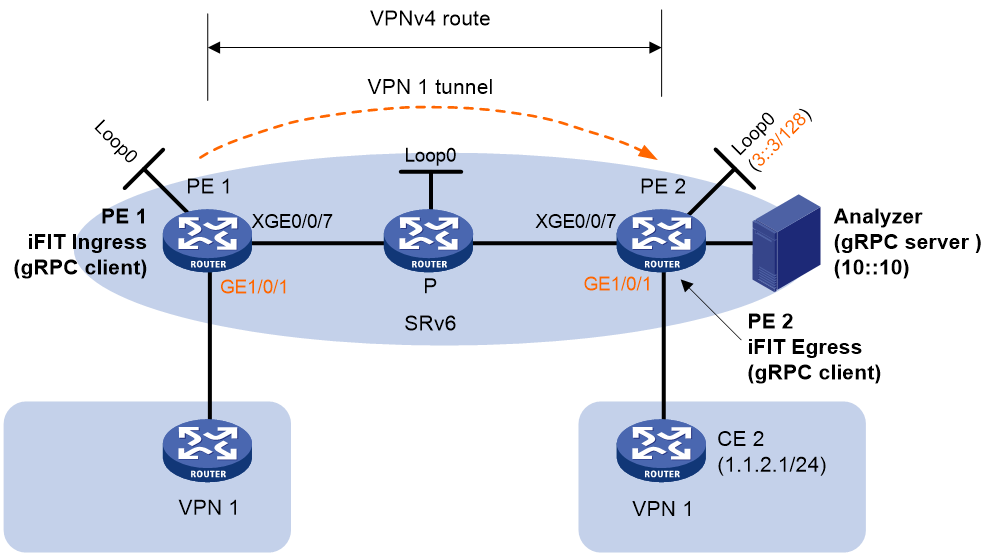
Example: Configuring iFIT in an IPv4 L3VPN over SRv6 network
Network configuration
As shown in Figure 9, the backbone network is an IPv6 network, and VPN 1 is an IPv4 network. Deploy MPLS L3VPN over SRv6 between PE 1 and PE 2 and use an SRv6 tunnel to transmit VPNv4 traffic between the PEs.
· Configure EBGP to exchange VPN routing information between the CEs and PEs.
· Configure IPv6 IS-IS on the PEs in the same AS to realize IPv6 network connectivity.
· Configure MP-IBGP to exchange VPNv4 routing information between the PEs.
· Configure iFIT to monitor the occurrence of packet loss and packet delay value when the flow passes through the VPN 1 tunnel.
Prerequisites
1. Configure IPv4 L3VPN over SRv6. (Details not shown.)
For information about configuring MPLS L3VPN over SRv6, see IP L3VPN over SRv6 configuration in Segment Routing Configuration Guide.
2. Configure NTP on PE 1 and PE 2 for clock synchronization. (Details not shown.)
For information about configuring NTP, see "Configuring NTP."
Procedure
1. Configure gRPC:
# Enable the gRPC service.
<PE1> system-view
[PE1] grpc enable
# Create a sensor group named test, and add sensor path ifit/flowstatistics/flowstatistic.
[PE1] telemetry
[PE1-telemetry] sensor-group test
[PE1-telemetry-sensor-group-test] sensor path ifit/flowstatistics/flowstatistic depth 2
[PE1-telemetry-sensor-group-test] quit
# Create a destination group named collector1. Specify a collector that uses IPv6 address 10::10 and port number 50050.
[PE1-telemetry] destination-group collector1
[PE1-telemetry-destination-group-collector1] ipv6-address 10::10 port 50050
[PE1-telemetry-destination-group-collector1] quit
# Configure a subscription named A to bind sensor group test with destination group collector1. Set the sampling interval to 5 seconds.
[PE1-telemetry] subscription A
[PE1-telemetry-subscription-A] sensor-group test sample-interval 5
[PE1-telemetry-subscription-A] destination-group collector1
[PE1-telemetry-subscription-A] quit
[PE1-telemetry] quit
2. Configure iFIT:
# Enable the iFIT functionality.
[PE1] ifit enable
[PE1-ifit] device-id 1
# Configure instance a to monitor the unidirectional flow passing through the VPN 1 tunnel.
[PE1-ifit] instance a
[PE1-ifit-instance-a] flow unidirection source-ip 1.1.1.1 24 destination-ip 1.1.2.1 24 vpn-instance vpn1
# Bind interface Ten-GigabitEthernet0/0/6 to instance a.
[PE1-ifit-instance-a] bind interface ten-gigabitethernet 0/0/6
# Specify 10 seconds as the measurement period.
[PE1-ifit-instance-a] period 10
# Enable iFIT measurement.
[PE1-ifit-instance-a] measure enable
[PE1-ifit-instance-a] quit
[PE1-ifit] quit
3. Configure PE 2:
# Configure gRPC.
Use the same procedure to configure gRPC on PE 2 as you configure gRPC on PE 1.
# Enable the iFIT functionality.
<PE2> system-view
[PE2] ifit enable
Verifying the configuration
1. View iFIT statistics on PE 1.
[PE1-ifit-instance-a] display ifit statistic device-id 1 flow-id 2
Period ID Direction PktCount Timestamp(sec, nsec) Interface
163059918 Ingress 4124 1630599180, 1889782 XGE0/0/6
163059919 Ingress 4124 1630599190, 1901494 XGE0/0/6
163059920 Ingress 4124 1630599200, 1912118 XGE0/0/6
2. View iFIT statistics on PE 2.
[PE2] display ifit statistic device-id 1 flow-id 2
Period ID Direction PktCount Timestamp(sec, nsec) Interface
163059918 Egress 4124 1630599180, 1948185 XGE0/0/6
163059919 Egress 4124 1630599190, 1959405 XGE0/0/6
163059920 Egress 4120 1630599200, 1968503 XGE0/0/6
3. Packet loss occurs in period 163059920 by viewing iFIT statistics on the analyzer.
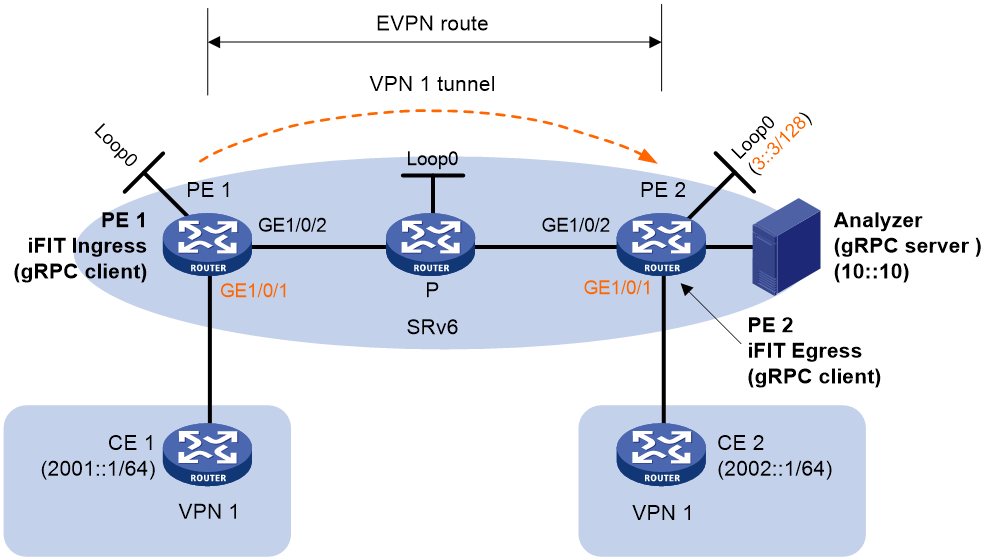
Example: Configuring iFIT in an IPv6 EVPN L3VPN over SRv6 network
Network configuration
As shown in Figure 10, the backbone network is an IPv6 network. Deploy EVPN L3VPN over SRv6 in SRv6-BE mode between PE 1 and PE 2 and use an SRv6 tunnel to transmit EVPN traffic between the PEs.
· Configure EBGP to exchange VPN routing information between the CEs and PEs.
· Configure IPv6 IS-IS on the PEs in the same AS to realize IPv6 network connectivity.
· Configure MP-IBGP to exchange EVPN routing information between the PEs.
· Configure iFIT to monitor the occurrence of packet loss and packet delay value when the flow passes through the VPN 1 tunnel.
Prerequisites
1. Configure IPv6 EVPN L3VPN over SRv6. (Details not shown.)
For information about configuring IPv6 EVPN L3VPN over SRv6, see EVPN L3VPN over SRv6 configuration in Segment Routing Configuration Guide.
2. Configure NTP on PE 1 and PE 2 for clock synchronization. (Details not shown.)
For information about configuring NTP, see "Configuring NTP."
Procedure
1. Configure gRPC:
# Enable the gRPC service.
<PE1> system-view
[PE1] grpc enable
# Create a sensor group named test, and add sensor path ifit/flowstatistics/flowstatistic.
[PE1] telemetry
[PE1-telemetry] sensor-group test
[PE1-telemetry-sensor-group-test] sensor path ifit/flowstatistics/flowstatistic depth 2
[PE1-telemetry-sensor-group-test] quit
# Create a destination group named collector1. Specify a collector that uses IPv6 address 10::10 and port number 50050.
[PE1-telemetry] destination-group collector1
[PE1-telemetry-destination-group-collector1] ipv6-address 10::10 port 50050
[PE1-telemetry-destination-group-collector1] quit
# Configure a subscription named A to bind sensor group test with destination group collector1. Set the sampling interval to 5 seconds.
[PE1-telemetry] subscription A
[PE1-telemetry-subscription-A] sensor-group test sample-interval 5
[PE1-telemetry-subscription-A] destination-group collector1
[PE1-telemetry-subscription-A] quit
[PE1-telemetry] quit
2. Configure iFIT:
# Enable the iFIT functionality.
[PE1] ifit enable
[PE1-ifit] device-id 1
# Configure instance a to monitor the unidirectional flow passing through the VPN 1 tunnel.
[PE1-ifit] instance a
[PE1-ifit-instance-a] flow unidirection source-ipv6 2001::1 64 destination-ipv6 2002::1 64 vpn-instance vpn1
# Bind interface Ten-GigabitEthernet0/0/6 to instance a.
[PE1-ifit-instance-a] bind interface ten-gigabitethernet 0/0/6
# Specify 10 seconds as the measurement period.
[PE1-ifit-instance-a] period 10
# Enable iFIT measurement.
[PE1-ifit-instance-a] measure enable
[PE1-ifit-instance-a] quit
[PE1-ifit] quit
3. Configure PE 2:
# Configure gRPC.
Use the same procedure to configure gRPC on PE 2 as you configure gRPC on PE 1.
# Enable the iFIT functionality.
<PE2> system-view
[PE2] ifit enable
Verifying the configuration
1. View iFIT statistics on PE 1.
[PE1-ifit-instance-a] display ifit statistic device-id 1 flow-id 2
Period ID Direction PktCount Timestamp(sec, nsec) Interface
163059918 Ingress 4124 1630599180, 1889782 XGE0/0/6
163059919 Ingress 4124 1630599190, 1901494 XGE0/0/6
163059920 Ingress 4124 1630599200, 1912118 XGE0/0/6
2. View iFIT statistics on PE 2.
[PE2] display ifit statistic device-id 1 flow-id 2
Period ID Direction PktCount Timestamp(sec, nsec) Interface
163059918 Egress 4124 1630599180, 1948185 XGE0/0/6
163059919 Egress 4124 1630599190, 1959405 XGE0/0/6
163059920 Egress 4120 1630599200, 1968503 XGE0/0/6
3. Packet loss occurs in period 163059920 by viewing iFIT statistics on the analyzer.
Configuring tunnel-level iFIT measurement
Prerequisites
For information about configuring SRv6 TE policies, see SRv6 TE policies configuration in Segment Routing Configuration Guide.
Before configuring iFIT, make sure the ingress node and egress node are time synchronized through PTP. For more information about PTP, see PTP configuration in Network Management and Monitoring Configuration Guide.
Configuring the ingress node
1. Enter system view.
system-view
2. Enable iFIT and enter iFIT view.
ifit enable
By default, iFIT is disabled.
3. Configure the device to act as iFIT Analyzer and enter iFIT Analyzer view.
work-mode analyzer
By default, the device does not act as iFIT Analyzer.
4. Configure iFIT to collaborate with SRv6 TE policies.
service-type srv6-segment-list
By default, the collaboration between iFIT and SRv6 TE policies is disabled.
Configuring the egress node
1. Enter system view.
system-view
2. Enable iFIT and enter iFIT view.
ifit enable
By default, iFIT is disabled.
3. Configure the device to act as iFIT Collector and enter iFIT Collector view.
work-mode collector
By default, the device does not act as iFIT Collector.
4. Configure iFIT to collaborate with SRv6 TE policies.
service-type srv6-segment-list
By default, the collaboration between iFIT and SRv6 TE policies is disabled.
Verifying and maintaining iFIT tunnel-level iFIT measurement
Perform display tasks in any view.
· Display global information of iFIT target flows.
display ifit global-information
· display information about the iFIT flow for the SRv6 TE policy.
display ifit srv6-segment-list [ segment-list-id ]
· Display the iFIT measurement result from iFIT Analyzer.
display ifit statistic-type { one-way-delay | two-way-delay | one-way-loss } { srv6-segment-list segment-list-id | device-id device-id flow-id flow-id }
